🍑 Project Context
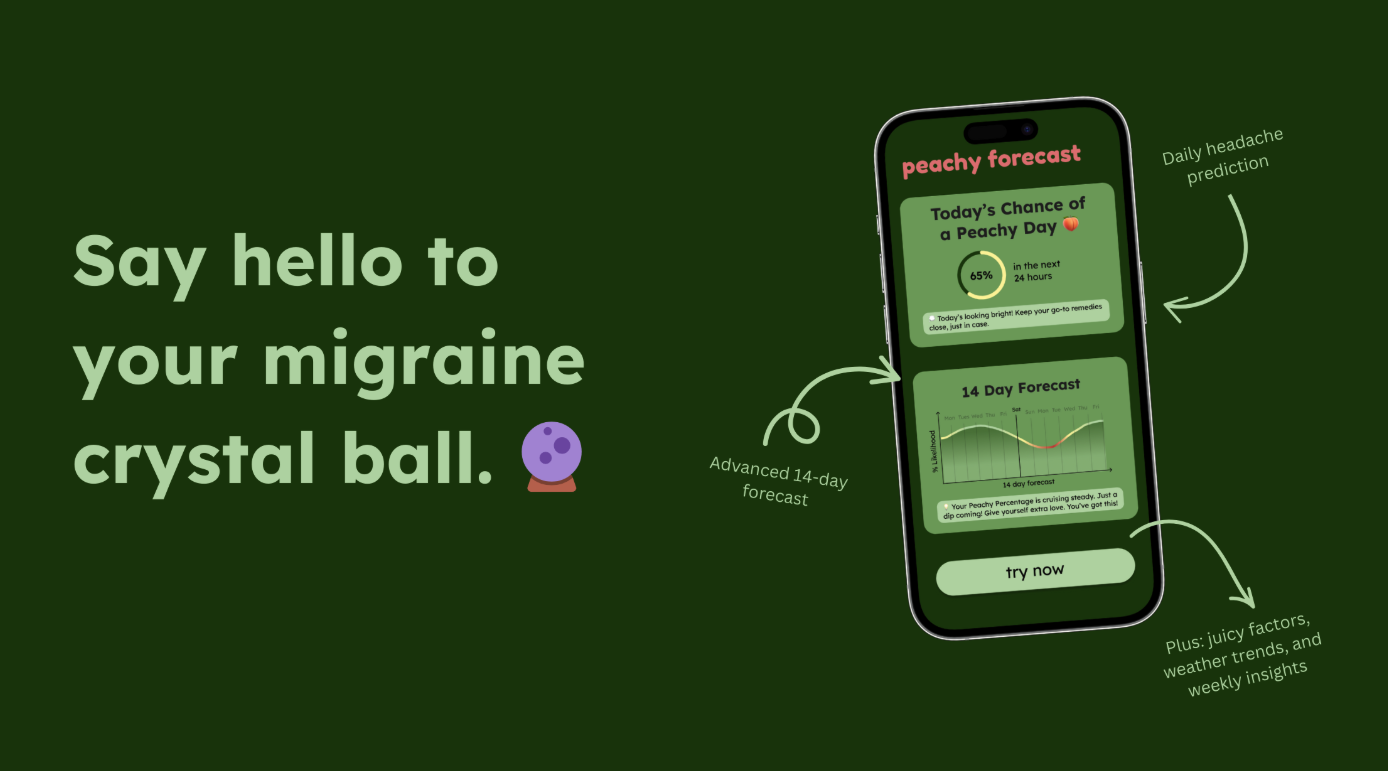
PeachyDay is a digital health startup helping patients manage chronic migraines. As a Data Scientist, I bridged the gap between raw data and business strategy by defining the product metrics framework and building the core ML features.
🛠 Technical Challenges
- Lack of Visibility: The team had raw data but lacked defined KPIs to measure product health or feature success.
- Clinical Validity: A “black box” model is useless in healthcare; predictions must align with medical understanding.
- User Retention: Users lacked motivation to log data daily without immediate feedback.
💡 My Solutions
1. Product Analytics & Metrics Framework
I established the internal analytics system to track product health and user behavior.
- KPI Definition: Worked with stakeholders to define “North Star” metrics (e.g., DAU/MAU ratio, Feature Adoption Rate) and translated vague business questions into precise SQL queries.
- Monitoring: Built automated dashboards to track user interaction flows, helping the team identify drop-off points in the onboarding process.
- Impact: Transformed decision-making from intuition-based to data-driven, directly influencing the roadmap for the next 2 quarters.
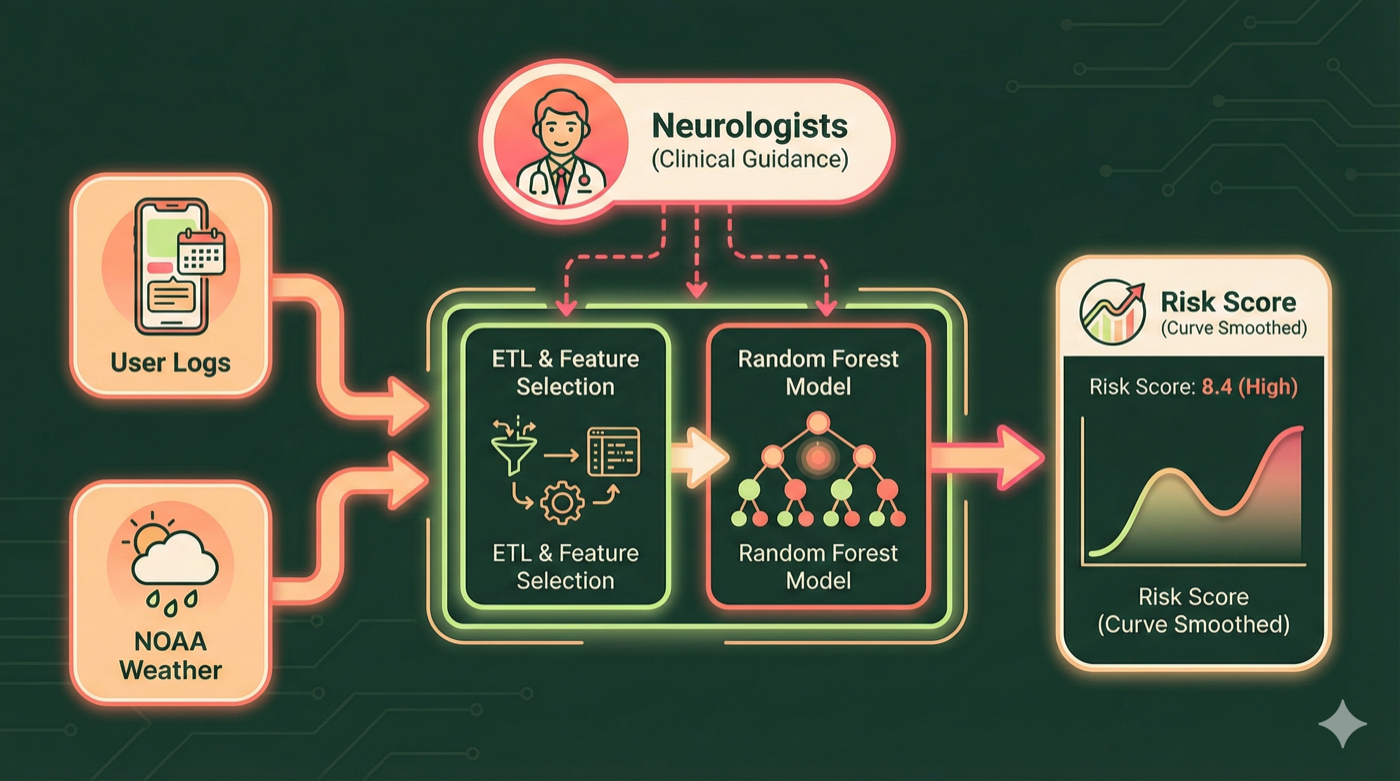
System Architecture with Physician-in-the-Loop
2. Physician-Guided Forecasting Engine
I developed an end-to-end prediction pipeline that translates clinical expertise into mathematical models.
- Domain-Driven Feature Selection: Collaborated with clinicians to identify medically relevant triggers (e.g., focusing on barometric pressure changes) and filter out noisy variables.
- Clinical Calibration: Applied post-processing techniques to smooth prediction curves based on doctors’ advice, preventing false alarms and modeling the gradual onset of attacks.
- Model Performance: The final Random Forest model achieved an 18% accuracy boost over the baseline.
3. “Migraine Wrapped” Data Product
To improve retention, I engineered a Spotify-Wrapped style data story for 1,000+ users.
- Visualization: Showcased longitudinal behavioral trends (e.g., identifying personal habits).
- Impact: This personalized feedback loop drove a 12% increase in user engagement.
🚀 Key Results
- Established the company’s first standardized Product Metrics Framework.
- 18% Improvement in Forecast Accuracy via Clinical Feature Engineering.
- 12% Uplift in User Engagement via Data Storytelling.
Note: Code is proprietary. This page demonstrates the methodology, clinical collaboration, and business impact.