Project Overview
Renewable capacity additions are often treated as shorthand for power-sector decarbonization. This project asks a more uncomfortable question: when renewables are added, are fossil-fuel assets actually leaving the operating system, or are low-carbon assets simply being layered onto a still-persistent fossil base?
The work is based on my open-access paper, A stock-based framework for monitoring fossil persistence and renewable expansion in global power systems, published in Energy, Ecology and Environment in 2026.
Research Question
The central problem is that common transition indicators can blur together three different things:
- renewable capacity additions,
- fossil-fuel operating-stock contraction, and
- the forward-looking composition of project pipelines.
Those signals matter, but they are not interchangeable. A system can look greener because renewable projects are growing while still remaining structurally dependent on fossil assets. The project therefore focuses on the physical operating stock of power plants: what entered, what remained, and what visibly exited.
Data and Method
The analysis uses unit-level records from the Global Integrated Power Tracker to reconstruct the global operating power-plant stock from 2010 to 2026. Each unit is classified by commissioning year, retirement year when available, technology group, status, and region, allowing the project to track changes in renewable and fossil operating capacity over time.
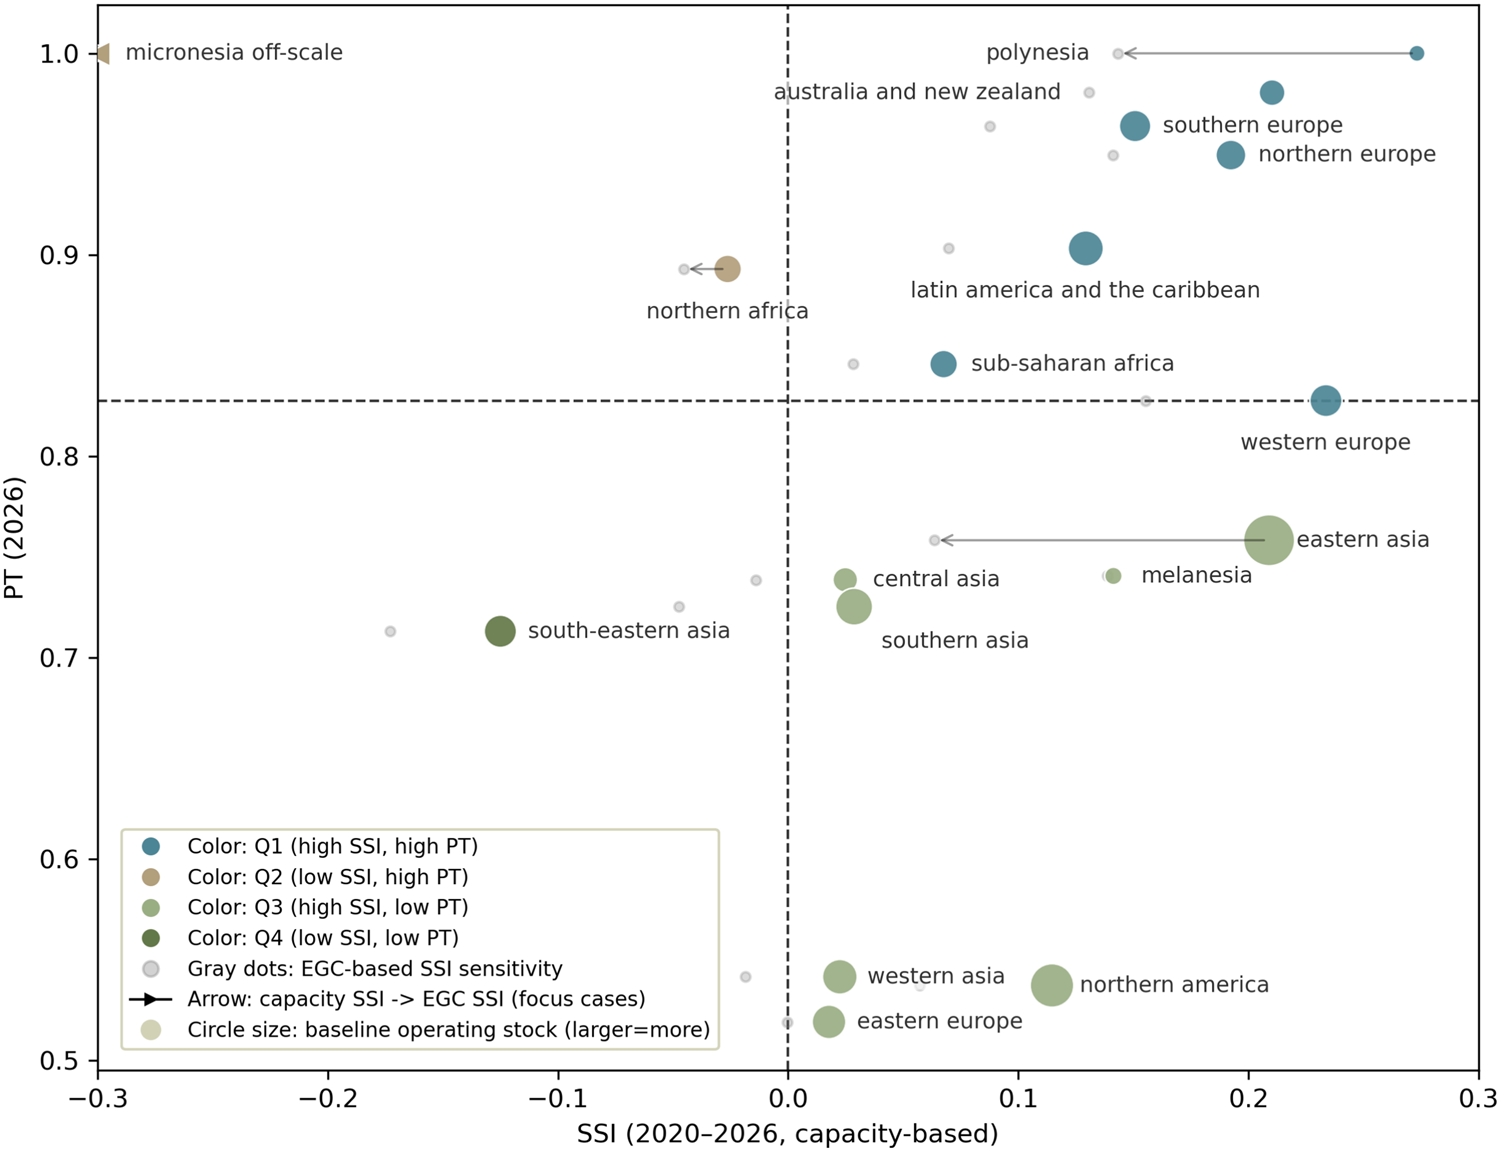
The core metric is Stock Substitution Intensity (SSI):
SSI = (renewable stock change - fossil stock change) / baseline renewable-plus-fossil stock
SSI is intentionally narrow. It measures stock-level structural reallocation in operating capacity. It does not directly measure generation displacement, emissions reduction, dispatch adequacy, or climate benefit. That boundary is central to the project: the point is to make the asset-stock dimension visible without overclaiming what it proves.
The framework also compares SSI with Pipeline Tilt (PT), the renewable share of announced, pre-construction, and under-construction project capacity. This separates realized stock change from forward-looking development intent.
Key Findings
The headline result is simple:
New renewable capacity does not automatically mean fossil-fuel capacity has been replaced.
Across global subregions, project pipelines are broadly renewable-leaning, with a median renewable pipeline share of 0.828. But realized stock reallocation is much more uneven. Among subregions with positive stock reallocation, 12 of 14 are still expansion-led, meaning renewable additions occurred alongside non-declining fossil operating stock.
Among the highest-ranking subregions by SSI, 80% show renewable additions layered onto a fossil base that did not contract. East Asia illustrates the scale of the issue: renewable capacity increased by 786.7 GW, while fossil operating capacity also increased by 311.7 GW over the same period. Australia and New Zealand stand out as one of the few cases that looks closer to actual stock replacement, with a small fossil decline.
Why Retirement Transparency Matters
A major data challenge is that asset entry is much easier to observe than asset exit. New plants and project pipelines are often visible, but retirements and decommissioning dates are less consistently recorded.
In the reconstructed dataset, about 198,000 MW of units lacked commissioning years, and another 73,000 MW were marked as operating despite having retirement evidence. Together, these issues created a 3.16% accounting gap.
This asymmetry matters because a monitoring system that sees additions more clearly than exits will tend to tell an optimistic story. The project treats retirement transparency as a governance problem, not merely a data-cleaning nuisance: if fossil exit is poorly observed, phase-out progress is difficult to verify.
Project Contribution
This project contributes a stock-based diagnostic framework for transition monitoring. Instead of asking only whether renewable capacity is growing, it asks whether the operating asset base is changing in a way consistent with fossil replacement.
The framework is useful for policy and research because it separates:
- renewable build-out,
- fossil operating-stock persistence,
- observed retirements and retirement transparency,
- project-pipeline orientation, and
- the scale of the existing asset base.
That separation helps avoid a common analytical shortcut: treating a green pipeline or a renewable addition as evidence of fossil displacement before the operating stock has actually changed.
Practical Takeaway
The project argues for a multi-indicator approach to power-sector transition monitoring. A single headline metric can easily become a single blind spot. Before using a clean-looking number to describe progress, the first question should be: what does this metric see, and what does it structurally miss?
For energy transition governance, the answer is especially important. The world may be building more renewable capacity, but climate-relevant transition also depends on whether fossil assets are retiring, shrinking, or simply persisting in the background.