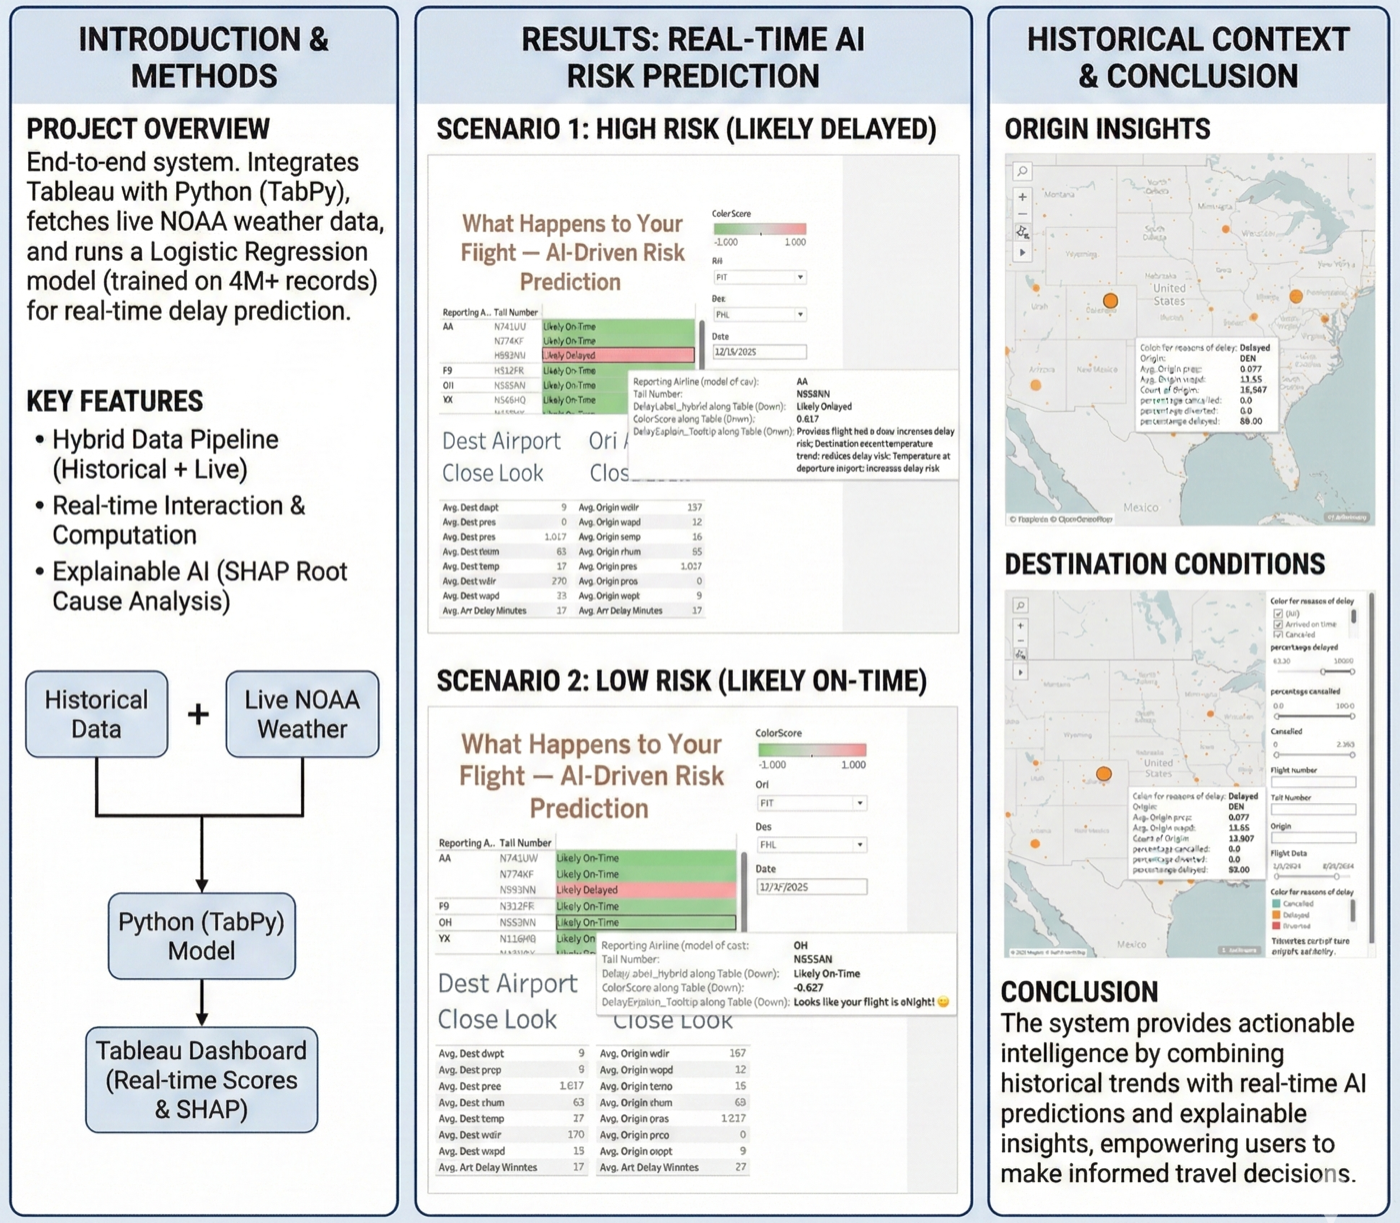
🚀 Project Overview
This project demonstrates an end-to-end flight delay prediction system. By integrating Tableau with Python (TabPy), the system fetches live weather data from the NOAA API and runs a Logistic Regression model (trained on 4M+ records) to predict delays in real-time.
🔑 Key Features
- Hybrid Data Pipeline: Merges historical rolling statistics with live API weather data.
- Real-time Interaction: Users select flight routes, and the model computes delay probabilities instantly.
- Explainable AI: Provides top-3 SHAP root cause explanations for every prediction.
📊 Visuals & Poster
Since Tableau Public does not support external Python scripts (TabPy), the interactive dashboard above utilizes a static dataset snapshot for demonstration.
🛠 Technical Architecture
- Data Source: Bureau of Transportation Statistics (BTS) & NOAA Weather API.
- Model: Logistic Regression (Scikit-learn) and SHAP, optimized for inference speed.
- Integration: TabPy server acting as the bridge between Tableau frontend and Python backend.